Research Workflow forResearch Workflow for
Fundamental Investors.
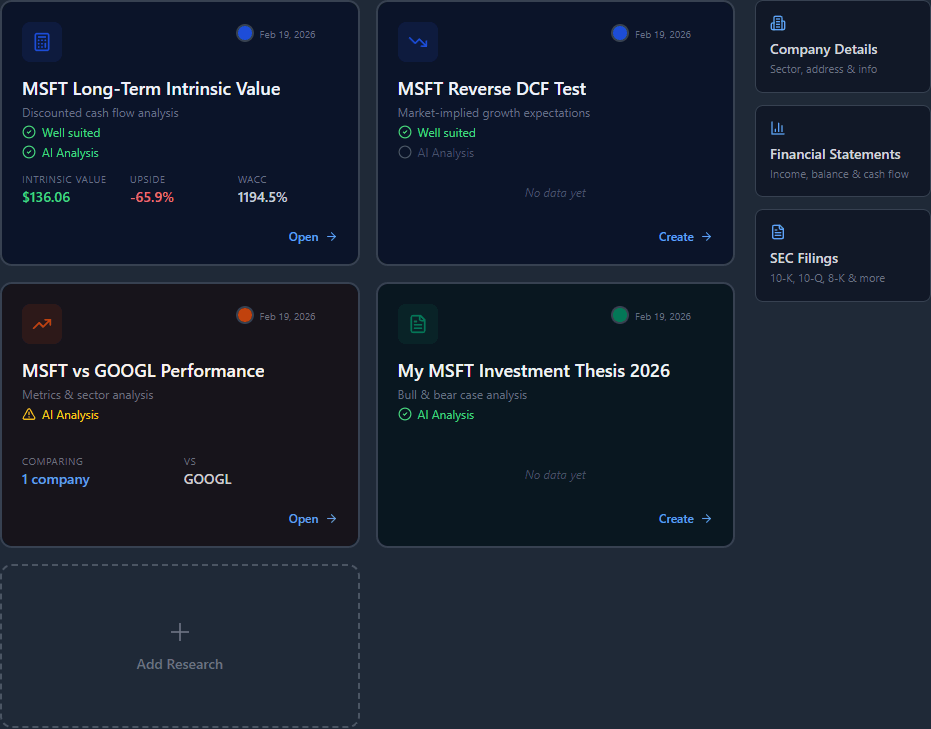
Model intrinsic value. Revisit your thesis. Challenge it with AI.
Model intrinsic value. Revisit your thesis. Challenge it with AI.


Enriched with Deep Financial Insights.
Powered by AI.
Narrative & Inflections
APP has shown a remarkable recovery since 2022, with net income rebounding from a loss of $192.75M to a profit of $356.71M in 2023, signaling a successful turnaround strategy. This shift is likely driven by operational efficiencies and improved market positioning, as evidenced by the substantial increase in gross margins, which rose from 55.41% in 2022 to 67.74% in 2023. In contrast, U has struggled with persistent losses, with net income worsening from -$532.61M in 2021 to -$822.01M in 2023, indicating deeper structural issues that may hinder recovery.
Build Your
Financial intelligence stack.
Structured financial models. Industry-native comparison. AI that challenges your thesis.
Be first to access the full platform at launch.
Join early. Shape the platform. Lock in launch pricing.
No spam, ever.